
Objective
To visualize Chicago crime statistics through choropleth maps and population-distorted cartograms for various geospatial data.
Approach
Freely-available crime and population data were collected from the city of Chicago data website.
The following varieties of geospatial data were collected from geojson and shape files:
- Elementary school attendance boundaries
- High school attendance boundaries
- Block group boundaries
- Census block boundaries
- Census tract boundaries
- Zip code boundaries
In addition to the plots utilizing the boundary data mentioned above, school coordinates were filtered out to plot crime statistics for:
- Closest elementary school
- Closest high school
Crime data were filtered into homicides and non-fatal shootings. Geographic coordinates for each crime were transformed into the US National Atlas Equal Area system.
Voronoi transform was applied to the closest elementary school and closest high school coordinates to generate boundaries for those maps. All 8 boundary systems were transformed into the US National Atlas Equal Area system.
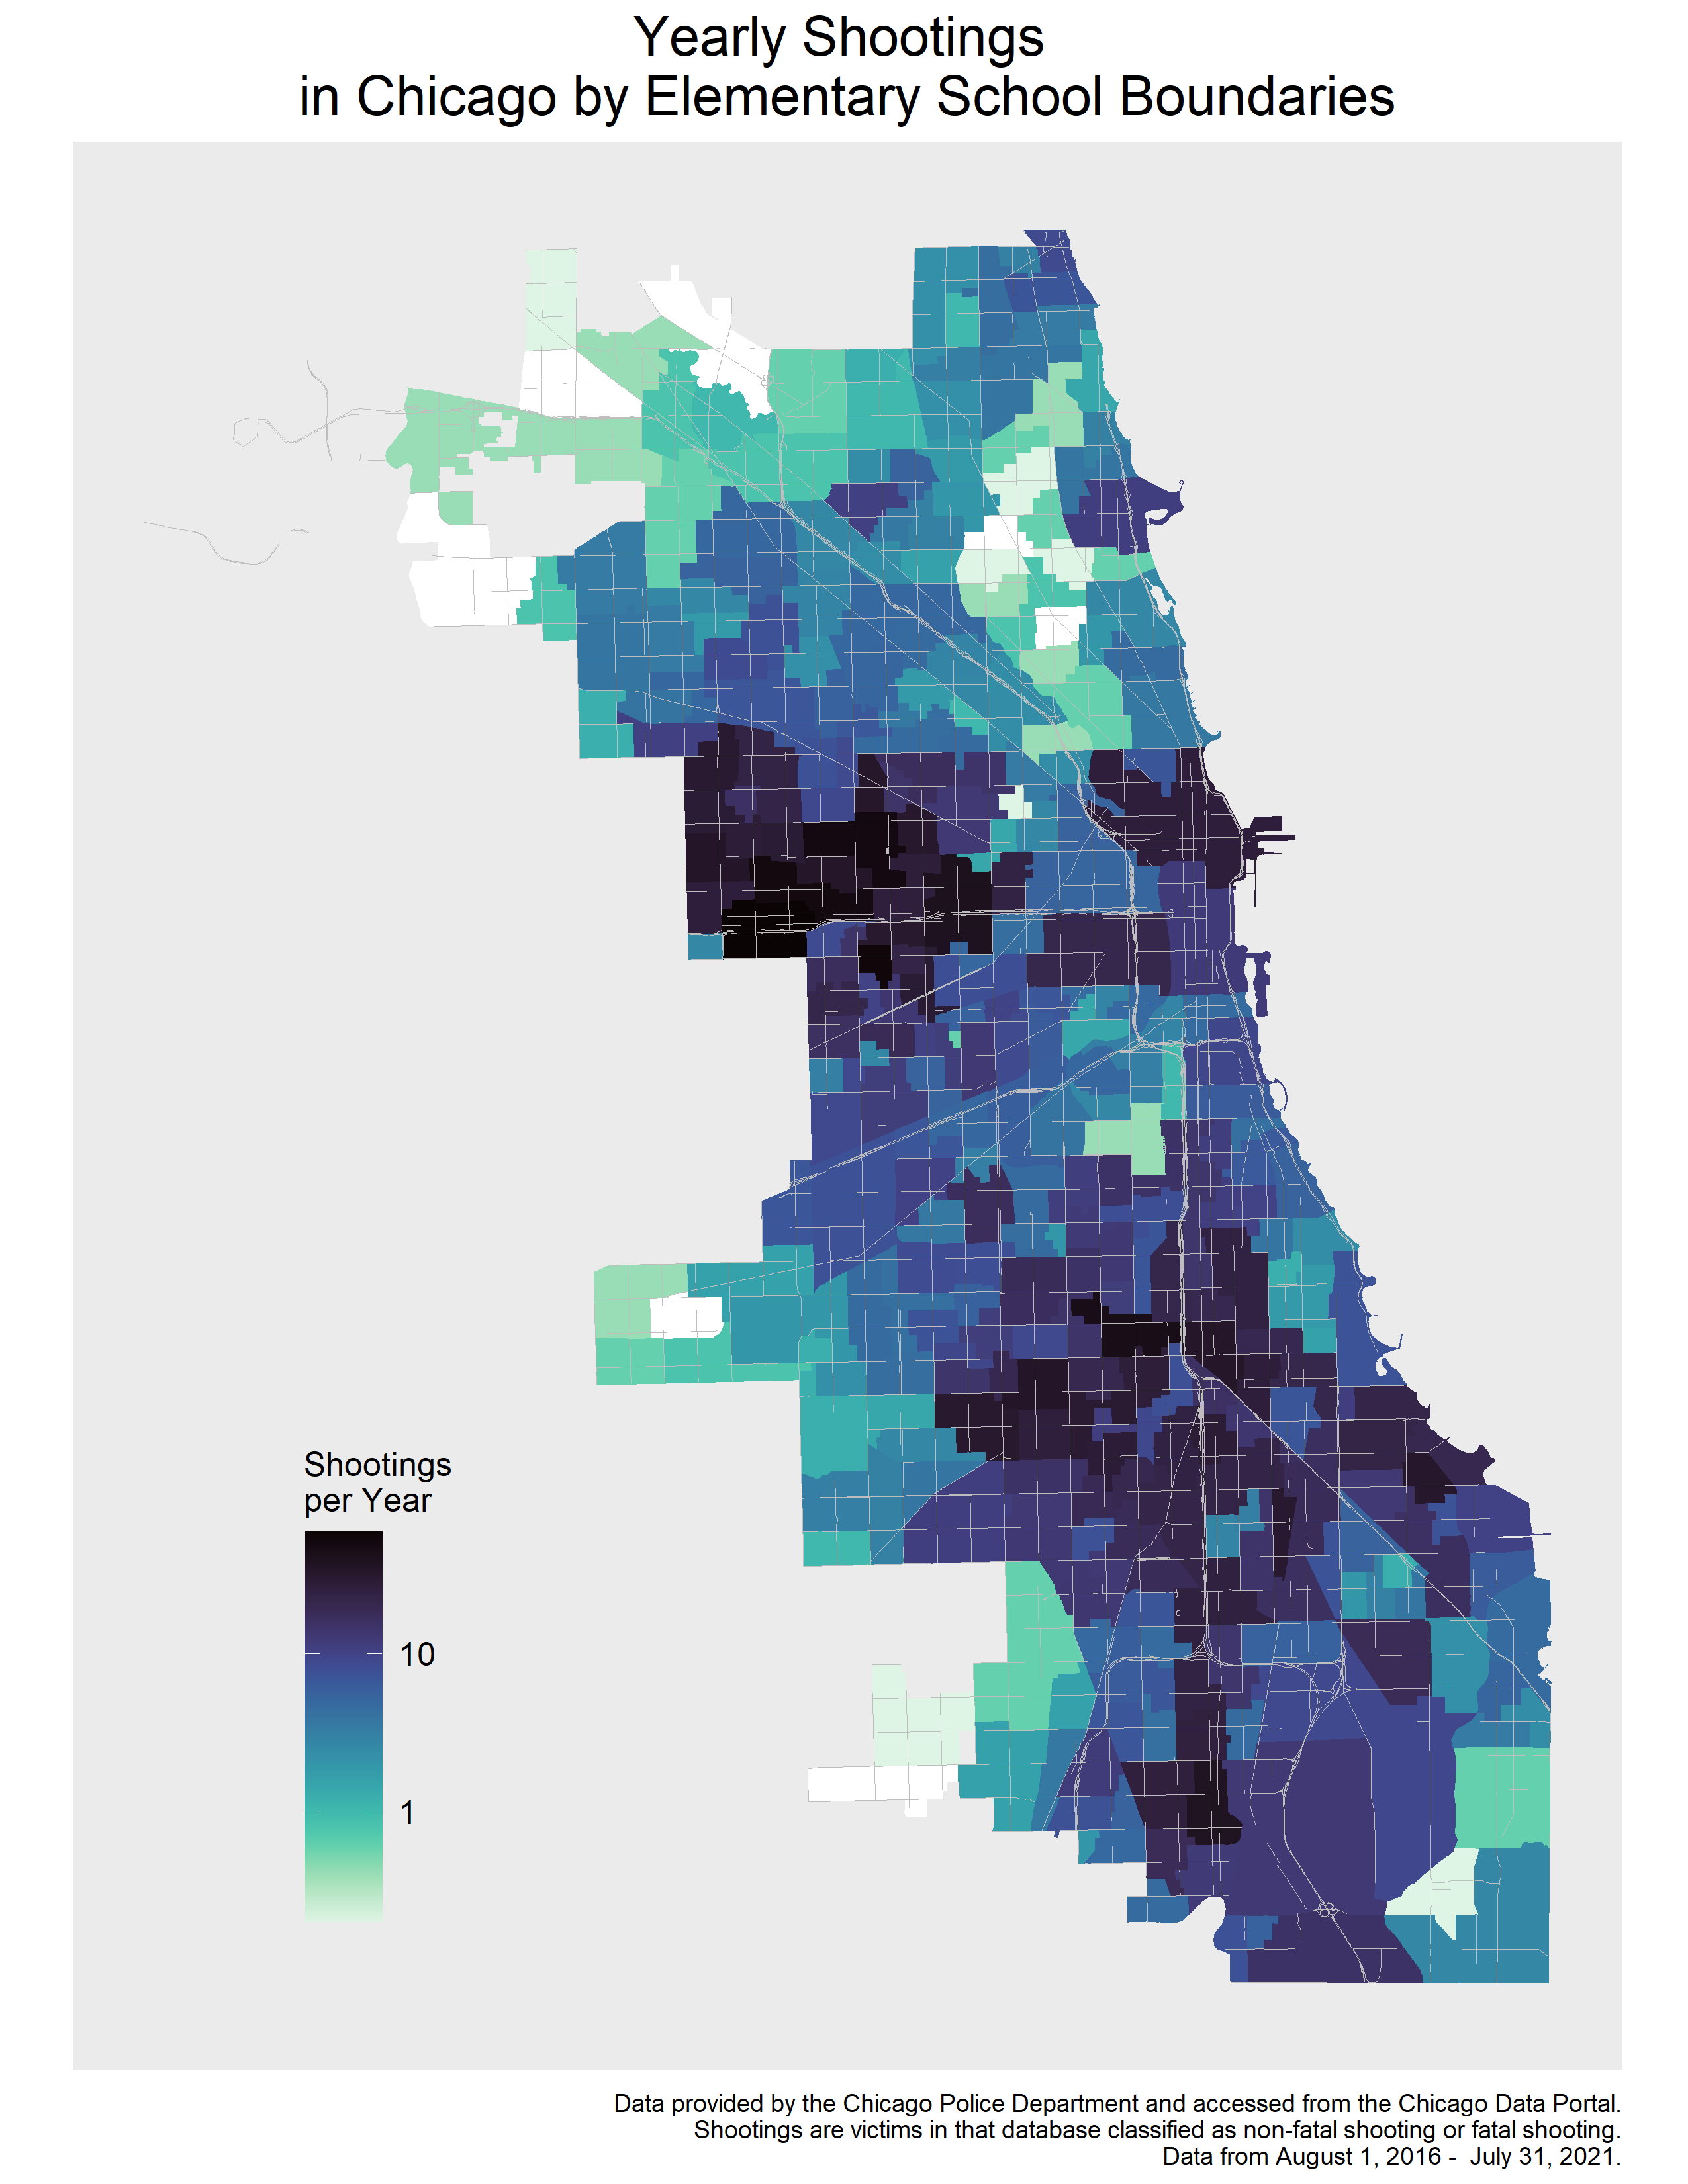
Results
The intersection of crime coordinates and 8 boundary systems resulted in 28 choropleth maps and 6 population-distorted cartograms.
Presenting below 2 of these maps.
Yearly Homicides in Chicago by Census Tract
Homicides Cartogram by Closest Elementary School