
Objective
To utilize the “Online Retail” dataset from the UCI Machine Learning Repository and analyze sales performance and customer behavior.
Data Preparation
Missing text values were imputed. Weird values, negative quantities and prices, were filtered out.
Months were selected as the basic temporal unit of evaluation. A new column called ‘Time Period’ was created. December 2010 was set as Time Period 1, and so on, and November 2011 was set as Time Period 12.
A new column called ‘Revenue’ was created as the product of Quantity and Unit Price.
Data was collapsed into 2 different data sets:
i. Customer-centric, and
ii. Stock-centric
i. In Customer-centric data, each row had a unique combination of Customer ID and Time Period. Quantity, Price, and Revenue were aggregated to get the average Quantity, average Price, and average Revenue per Customer ID per Time period. Quantity and Revenue were also aggregated to get the total Quantity and total Revenue per Customer ID per Time period
ii. In Stock-centric data, each row had a unique combination of Stock Code and Time Period. Quantity, Price, and Revenue were aggregated to get the average Quantity, average Price, and average Revenue per Stock Code per Time period. Quantity and Revenue were also aggregated to get the total Quantity and total Revenue per Stock Code per Time period
Predictive Analytics
Machine Learning models were fit to both sets of data
a. In Customer-centric data, customer ID, country, and Time Period were used to predict the average Quantity, average Price, average Revenue, total Quantity, and total Revenue per Customer ID per Time period for all customer IDs for the following time periods: 13 (December 2011), 14 (January 2012), 15 (February 2012)
b. In Stock-centric data, stock code, Time Period, and each word from the Description column (count-vectorized) were used to predict the average Quantity, average Price, average Revenue, total Quantity, and total Revenue per Stock Code per Time period for all Stock Codes for the following time periods: 13 (December 2011), 14 (January 2012), 15 (February 2012)
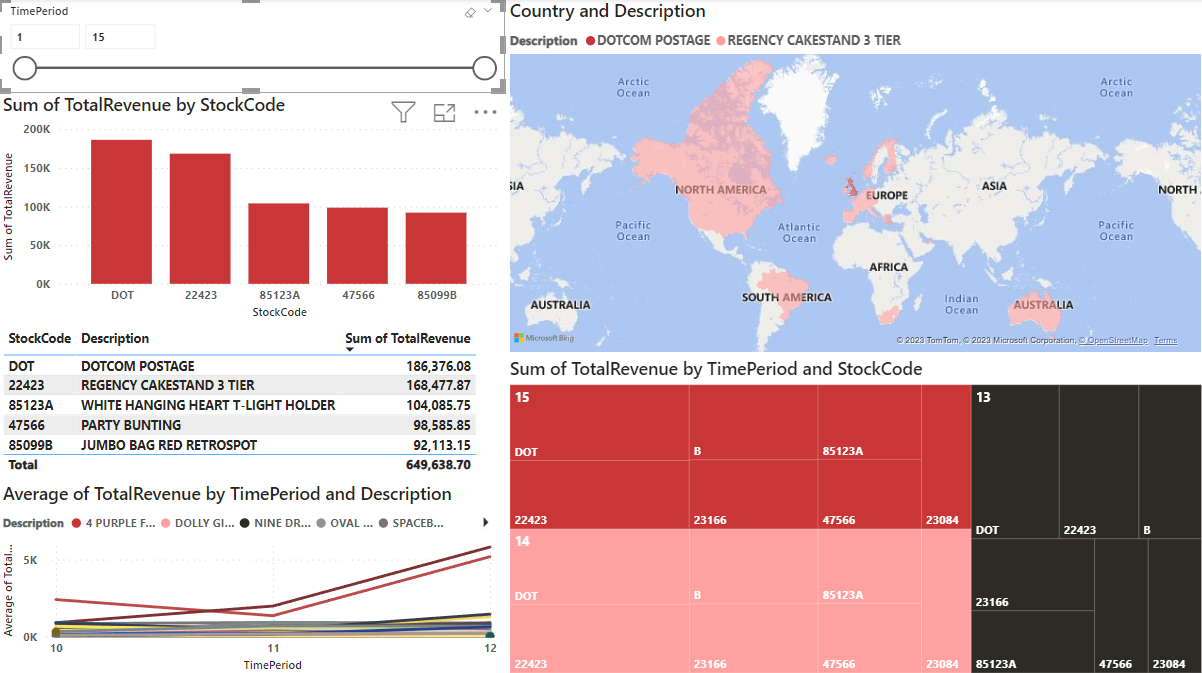
Visualizations
Power BI was utilized to create dashboards.

Customer Behavior Dashboard

Stock Sales Dashboard